NPS index. Tracking customer loyalty
What is most important in business? Of course, a satisfied client who will pay you regularly and is ready to recommend your company to everyone he knows. And one of the most common ways to measure customer loyalty to a company is the NPS index.
What is NPSThe NPS loyalty index, from the English Net Promoter Score, can be translated as a net promoter index. NPS is a measure of willingness to recommend a company or product. The promoter of the company is a person who is ready to recommend the company. NPS is sometimes referred to as Frederick Reicheld's Loyalty Management Technique.
The NPS Loyalty Index is a relatively recent development, first formulated by Frederik Reicheld in 2003. His article on NPS was published by the Harvard Business Review and discusses customer loyalty and the growth of the company's profits. Later, The Book of True Profits and Real Growth was released, in which Reicheld continued to describe the relationship between revenue and customer loyalty.
Why NPS is neededReicheld based his point of view on a study of more than 400 companies represented in various business sectors. The main topic was to compare the growth rate of the company and the industry with the NPS index. The most striking relationship was found in companies where the level of service is important, since the client often communicates with representatives of the company, for example: passenger air transportation, insurance and car rental. In the future, many large companies began to use the NPS loyalty index in their work.
Quarterly NPS changes help companies compare themselves to their main competitors and understand how effective the measures that the company uses are.
Most major players in the Russian telecom market measure NPS. So, among the Big Three operators, Beeline had the lowest NPS in 2013. However, thanks to the client-centric strategy announced in 2014, the company managed to raise this figure and come close to MTS, Mikhail Slobodin, General Director of Vimpelcom, assures.
“In the fourth quarter of 2013, unfortunately, we recorded a historical anti-record balance between those who recommend us and those who categorically do not recommend us. The gap with our competitors was simply catastrophic. Now we can already talk about it - then we modestly kept silent about it. The gap that we had more than a year ago, this simply cannot be allowed in the industry. And this, in fact, was reflected in the outflow of our key customer base. In 2014, we invested in making the client trust us again and stop running away from us like hell from incense. And over the past four quarters, we have consistently improved this indicator, for the first time in the history of VimpelCom over the past five years. Now we are almost on par with MTS, a little bit left to Megafon,- Slobodkin said in an interview with Vedomosti.
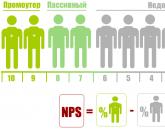
How to measure NPSTo measure the NPS index, a small survey is conducted, up to 10 questions. One of the questions sounds like this: how ready are you to recommend a company/product/service. The participant needs to enter a value from 1 to 10. According to the results of the survey, all participants are divided into 3 groups:
- 10-9 points - promoters, loyal customers who are ready to recommend;
- 9-7 points - passive, generally satisfied, but not ready to recommend;
- 0-6 points - dissatisfied, definitely will not recommend
The NPS index is calculated using the following formula:
NPS = share of promoters - share of dissatisfied
The NPS index is a faithful assistant on the way to creating a dynamically developing company that will change the market in ten years.

eNPS from the English Employee Net Promoter Score is an index of employee loyalty. Not so long ago, along with the development of the NPS index, they began to conduct surveys among employees, called eNPS by adding the word employee to the abbreviation.
Any manager knows that the company has external clients and internal (employees) and how satisfied the internal client is, the external ones are also satisfied. Already touched on the topic before. The eNPS index is a great tool to understand how ready your own staff is to be a promoter. A high eNPS will help you lower your NPS significantly, which means you'll save money on hiring and onboarding.
Just like NPS, the employee loyalty index is recommended to be assessed at least once a quarter. This will give you an idea of where your company is heading. In addition, it is worth evaluating the indicator not only for the whole company, but also for individual divisions. The value of the eNPS index is greatly influenced by the immediate supervisor.
The customer loyalty index (NPS - Net Promoter Scope) has been successfully used by companies for more than 15 years. This is a fairly simple way to assess customer loyalty to the company.
NPS or Consumer Loyalty Index is a relatively young research method. The concept was pioneered by Frederick Reicheld, who published it in 2003 in the Harvard Business Review, calling the study One Number You Need to 'Grow'. In his study, the author insisted that in order to find out about the attitude of customers to the company, it is enough to ask just one question: “How likely are you to recommend the company/product/brand to your friends/colleagues?” After collecting and analyzing the answers, you can calculate the index, which consists of several steps:
1. Consumers are asked to rate on a scale of 1 to 10 the likelihood that they would recommend a company/product/brand to their friends/colleagues;
2. Based on the ratings received, all consumers are divided into three groups: Those who gave nine and ten points - "promoters", seven and eight points - "neutrals", six points and below - "critics";
3. The NPS index is calculated as the percentage difference between the number of "supporters" and "critics". The assessment range is from -100 to +100, where NPS 100 is the best scenario, in which all your customers are “supporters” of the brand, and NPS -100, respectively, is the worst.
It should be noted that in the West, loyalty studies are carried out with enviable regularity, unlike in Russia. For example, the global retail leader Amazon has an NPS of 61%, while electronics manufacturer Apple has an NPS of 89%*. Unfortunately, there are no consolidated data on the NPS indicators of Russian companies, and the study is not carried out often. In the summer of 2017, UBS Evidence Lab published figures for Russian retailers: of the 14 largest players, five have positive values. The highest NPS was received by "Lenta" - 7% and "Okay" - 3%. In the banking sector, Sberbank's loyalty reaches 59%, in telecommunications Tele2 has 35%, Megafon has 17%, and Beeline has 25%.
Nevertheless, despite the fact that the method has quite a few followers, NPS has 5 main problems, which we will consider in this article, and we will also offer solutions, knowing which and successfully applying in practice, you will be able to manage customer focus and service level .
Problem #1: NPS doesn't answer the question "Why?"
The first problem is that most companies stop at the stage of collecting NPS data. Suppose a company with a wide regional network of divisions has an NPS of 38%. When they get this data, they can say, “How wonderful, in the past year our score has increased from 32 to 38.” But at the same time, they will not find out the reasons why the index is moving (it should be noted that the movement can be in the opposite direction).
Therefore, the first thing to find out is why the company received this particular assessment, why the changes took place. Ask a series of questions, for example,
- Why did you give us this rating?
- Why did you choose 5?
Find out the reasons, and then dig even deeper, for example, using the philosophy of "Kaizen" (continuous improvement and improvement in business).
Issue 2: Be aware of the differences between regions and segments
Very often, when calculating the NPS index, regional values, customer segmentation are skipped, and the ranges can sometimes be very wide. For example, you can compare the NPS of customers who buy from you a lot and often with the NPS of new customers or those customers who had problems interacting with your company. Find out what the difference is in their NPS, because if you have a higher NPS with less important clients or your more difficult clients, that's a problem because they won't influence other people's opinions.
You should also pay attention to regional differences, because sometimes the difference between NPS indicators in different locations can reach tens of percentage points.
Problem 3: Inconspicuous middle
As we noted above, in order to calculate the index, the highest indicators (those who put 9 and 10 points) and the lowest (from 0 to 6 points) are taken. At the same time, when measuring, those respondents who put 7 and 8 points, the so-called middle of the rating, are ignored.
Mathematics and, as a result, analysts miss these clients, but you must understand that they are very important. Clients in these ranges can become both "promoters" and "critics". What can motivate them to move up and what can keep them from moving down the rankings is up to you to find out.
Problem 4: NPS is not measured widely and often
The problem is that NPS (like any category of surveys) are conducted more often than once or twice a year. Given the high pace of today's life, price changes and the dynamics of competition, this is too little. NPS should be a constant review of your work for you, and not just a check from time to time.
Problem 5: Always use the same communication channel
When interviewing customers, always try to use the same communication channel to evaluate NPS. For example, if you are conducting a telephone survey to compile an index, continue to use this channel for future surveys. By using different data collection methods, you run the risk of getting very disparate data. As practice shows, the results obtained through different communication channels can differ by tens of percent.
Most companies are overly focused on growing customers and growing profits. However, it is very important to understand the fact that it is like fishing with a holey net. It seems that you managed to "catch" a lot of fish, but as a result you are left with nothing.
Customer retention is not the goal, but consumer loyalty to the company is. The problem is that this indicator is very difficult to measure, as it is not quantitative. Fortunately, there is a blueprint to help you meet customer needs and build long-term, rewarding relationships with them. In addition, you will be able to predict their loyalty to your brand.
This article will focus on the basic concepts associated with such an indicator as the consumer loyalty index (NPS, Net Promoter Score). You'll learn how a simple one-question survey can help you measure your customer satisfaction. You will learn how to start using and further apply this indicator in your marketing campaigns.
Loyalty measurement methodologyThe founder of the NPS measurement methodology is Frederik Reicheld. His research was published in the Harvard Business Review in an article titled "One Number You need to Grow." In it, Reicheld criticized traditional customer satisfaction surveys. He said that all of them do not allow "to keep abreast" and assess how happy the buyers are.
As a result, Reicheld and his colleagues developed a simplified schema that linked consumer responses and behavior.
At the heart of measuring the consumer loyalty index is the belief that loyalty is nothing more than a person’s willingness to contact a company again and, more importantly, recommend a product or company to their friends. This indicator is determined very simply. We will talk about this now.
How to conduct a surveySo, NPS is an index that measures the desire of a consumer to recommend your company's products or services to their friends. To calculate it, you need to ask customers two questions:
Next, you need to create a survey and send it to your customers. Typically, such questionnaires are sent by e-mail, via SMS, offered in the form or asked by phone. Ideally, the survey should be completed in less than 24 hours.
Once your clients have answered both questions, you will need to divide them into the following categories based on their rating:
- 9-10: Brand Adherents (Promoters). They value your company's products and tend to recommend them to their friends and associates. They also often make repeat purchases. These customers are the most valuable.
- 7-8: Neutral consumers (Passives). They do not spread negative reviews about your company, but if someone makes them a better offer, they will refuse your services. Such customers do not often recommend you to their friends.
- 0-6: Detractors. They are dissatisfied with the quality of your company's products or services and want to ruin your reputation by spreading negative reviews.
Based on the audience segmentation data (see previous section), the consumer loyalty index can be calculated using a simple formula:
NPS = (% Brand Adherents) - (% Critics)
The value you get will be between -100 and 100. If your customer loyalty index is 100, it means that absolutely all of your customers are fans of your brand (best case scenario). If this indicator is equal to -100, then on the contrary, all your customers criticize you (worst case scenario).
Why is it worth tracking the consumer loyalty index?Periodic tracking of the consumer loyalty index is necessary, since this indicator:
- easy to understand - this system is very easy to understand and adapt for your company;
- easy to calculate - the survey is very short, and your customers will be able to quickly and easily answer the proposed questions;
- gives feedback of practical value;
- helps to identify the target audience segment (if you combine the information received with);
- will allow you to develop a plan to improve products or services;
- will help build a "customer cult" in your company - each department will be aimed at building long and fruitful relationships with customers;
- Gives you a competitive advantage - insights from NPS analysis will allow you to make decisions quickly, while your competitors will have to spend several months on it;
- is available for any business - conducting such surveys will not greatly affect the budget, and you will be able to "keep your finger on the pulse" of consumer sentiment.
- Extensive research has shown that NPS is one of the top indicators of growth. If it is higher than that of competitors, this means that your company has a larger market share.
- According to a Gartner study, 65% of start-up companies already have a ready-made customer base. Attracting new customers costs 5 times more than retaining old ones. The Customer Loyalty Score is an affordable way to measure customer satisfaction and retention.
- NPS can be used as a development metric to turn a company's current growth into sustainable growth.
- The consumer satisfaction index can be used to make decisions about the company's product itself.
- NPS allows you to correctly prioritize based on . They can get feedback very quickly and make changes to the marketing process.
- Verizon research has shown that 85% of new customers come to small companies thanks to. Keeping your NPS high will help you reach more customers without spending money on advertising and marketing campaigns.
- The Consumer Loyalty Index helps marketers measure the mood and opinions of customers, and then give feedback to all team members. Thus, all departments of the company will be able to work more harmoniously in order to achieve one common goal - customer satisfaction.
- NPS, combined with analytics tools, can help you predict consumer behavior and create so-called behavioral patterns.
- A customer loyalty score can help you determine the satisfaction level of your employees. This is especially important for companies operating in the service sector.
- NPS can also be used to select a new corporate culture vector. In addition, with the help of this indicator, you can find out the opinion of your employees about the new corporate policy.
- You can use NPS as the only customer satisfaction metric. To do this, the indicator must be measured on an ongoing basis and quarterly reports should be made. This will help you get meaningful insights and build a long-term plan for the development of the company.
- If you link NPS with financial statements, then you can draw a conclusion about the general state of development of the company. For example, if profits are growing and NPS is declining, then this is an alarming sign regarding the long-term development prospects.
- Increasing profits per customer: Brand loyalists tend to spend more on the company's products and services than the average customer.
- Reducing ongoing costs: Brand adherents are tolerant and tolerant of problems that arise in the company, so they are less likely to complain. This helps to reduce maintenance costs. In addition, loyal customers decrease as they spread positive feedback.
- Churn reduction: By reducing the number of neutral customers and critics, you can reduce customer churn.
- Motivation for employees: all departments of the company will work together to achieve a common goal.
Only 14% of customers stop using the company's services because they are not satisfied with the quality of service or the product itself. 69% of consumers stop using a company because they feel like they've been forgotten.
Most dissatisfied customers will never come to complain directly. They will just leave silently and then start leaving negative reviews online. That’s why it’s so important to keep “connected” with your customers all the time.
Continuous measurement of NPS will allow you to identify those customers who:
- are going to refuse the services of the company;
- ready to act as “advocates” of the brand;
- see any shortcomings in your product or services, but do not talk about them.
With this valuable information, you can prevent.
When to conduct a survey?Often, the effectiveness of an NPS campaign is not about how you ask questions, but when you ask them. Here are a few "right things":
1. After the potential client has used the free test period (Post Free Trial). If the trial period has expired and the customer does not want to purchase the paid version, then this is an indication that he is interested, but not yet sufficiently involved in the purchase process. Why not ask him to give you feedback to find out what went wrong.
2. Before the client finally refuses the services of the company (Exit Survey). The price is a repulsive factor for a person only when he does not see the value of the product. If a client decides to break off their relationship with a company after having already used their services for a while, this means that you are doing something wrong. Instead of just letting him go, you can re-engage him by asking him to take a survey. Even if that client leaves anyway, you can learn valuable insights.
Criteria for evaluating the consumer loyalty indexYou can't draw objective conclusions just by looking at your customer loyalty score. It is necessary to take into account the position of the company in the chosen business area. For example, the NPS of a large store may be 30, but it will still be the worst in the market. At the same time, the telecommunications company's NPS will be 32, and it will be the leader among competitors.
What factors influence the NPS evaluation criteria? How do you know if your customer loyalty score is good? First of all, there are three factors that affect the criteria for evaluating the consumer loyalty index:
1. Level of competitionIf you are in a highly competitive industry such as insurance, banking, or healthcare, then an average NPS would be considered normal. But if your company only covers a small segment of the market (such as electric cars or wireless headphones), then you need to make sure that your NPS is high enough. This will be an indicator that your offer is unique and that your customers perceive your brand positively.

Optimal NPS indicators for different business areas: banking (0), auto insurance (22), health and life insurance (27), airlines (36), tourism (38), hotels (43), online shopping (45), Internet -services (48).
2. ToleranceCustomer tolerance is another key factor that determines the NPS score criteria. This is due to the fact that people are peremptory about how good a product or service they use regularly is.
To visualize how this factor affects NPS, you need to give an example. Verizon's Consumer Loyalty Index is 38, which may seem like a very average value, but this company occupies one of the leading positions in the market. By comparison, their competitors (AT&T and MediaCom) have scores of 15 and 22. This low score is not due to the company's lack of quality service. This means that these firms operate in a highly competitive environment where customers are absolutely unwilling to tolerate even minor "errors" in the quality of service.
3. ObstaclesUsually, a person cannot afford to improve ("upgrade") the purchased product or start using the services of another company without certain financial losses. Thus, in order to appear consistent in their decisions, the client prefers to remain committed to the same brand.
SaaS companies face this problem all the time. To become a client of one of these firms, you need to deposit a certain amount, so it is very difficult for a business to retain its customers and maintain their loyalty. In this regard, the NPS indicator of SaaS companies is kept at “below average” levels.
What is considered a good indicator of NPS?So, there is no quantitative indicator that can be called good, since this value varies depending on what kind of business you are in. But there are a few questions that you can ask yourself to understand how high your consumer loyalty index is:
It must be remembered that the consumer loyalty index should not be taken literally. Most companies are simply obsessed with growth rates and do everything possible and impossible to make performance indicators grow. NPS is not a quantitative metric. It is rather a qualitative indicator that gives you food for thought.
In general, while NPS claims to be the new standard for measuring customer satisfaction and loyalty, it has been criticized for its simplicity. Some experts say that the index does not give an accurate picture of how happy a company's customers are. For example, they highlight the fact that companies with the same NPS may have different percentages of adherents, neutral consumers, and detractors. Therefore, entrepreneurs need to focus not on the indicator itself, but on what these numbers tell them.
What to do after measuring NPSThis section will summarize the goals of measuring the loyalty index and will also close the customer feedback loop. This inclusive strategy will give you consistent growth and keep track of customer churn.
1. Critics: Make a Personal TouchAccording to a study by Lee Resources, 70% of clients are ready to use the services of the company again if an unpleasant situation is resolved in their favor. Your goal here is to show your customers that you care.
Most companies believe that the category of customers called "critics" is impossible to convince. However, this is not at all the case. In fact, those customers who want to end their relationship with the company and spread negative reviews are the future adherents of your brand. They just want you to pay attention to them and solve their problem.
Perhaps emails with questions about possible problems and ways to solve them will help you regain lost customers, for example:
- What would you like to do with our product but can't?
- Could you formulate an ideal solution to your problem that would completely satisfy you?
- If you had a magic wand, what changes would you make to the product?
Once you receive feedback, you can take the following actions to keep your customers:
- provide them with instructions (if your product has the desired function);
- extend the trial period and give access to premium features;
- offer any third-party service that would help solve their problem.
By offering solutions to problems, you can turn critics into brand followers.
2. Passive Consumers: Engage Before They LeavePassive customers are a very interesting category of customers: they don't love your product, but they don't hate it either. It seems that they are just waiting for something good or bad to happen in order to make a specific decision.
However, passive consumers are not inclined to answer open-ended questions and give business owners feedback. For example, Zendesk found that only 37% of this customer category responded to a survey. While 50% of critics and 55% of the company's supporters share their opinion about the company's services with pleasure.
It seems like passive consumers can't ruin your brand's reputation. But they, like critics, are more likely to refuse your services. Here are the steps you can take to keep these customers:
- By offering discounts or upgrades, you can re-engage passive consumers in the buying cycle.
- Send them introductory user guides: they may not be involved in the purchase process due to an unfavorable first impression, as a result of which they never return to the site. You can periodically send them various brochures that tell them about the latest releases or new features of your product.
Brand loyalists are, without a doubt, the ideal customers for any company. But most firms take them for granted in vain. They make no attempt to reward or thank those clients who bring them the most income.
Undoubtedly, gratitude will help strengthen your relationship with this category of buyers, and will also contribute to the development of the company.
Here is what you can do for this:
According to statistics, the average share of people responding to an NPS survey is 60%. Thus, each company will have at least 40% of those customers who did not answer the questionnaire. Surprisingly, according to several studies, this category of customers is more likely than others to refuse the services of your company in the future.
In fact, you're more likely to re-engage a critic than you are to convince a customer who didn't take the survey. If no action is taken, then usually 40-70% of these people stop contacting the company within the next 6 months.
The only way to interest them is the methods described above. The same tactics are suitable for them as for critics and indifferent consumers.
ConclusionGathering information about how customers feel about your brand is an integral part of a long-term growth perspective. Of course, the consumer loyalty index has its drawbacks, but they can be overcome through the active implementation of effective metrics.
Tips for working with the NPS consumer loyalty index: how to sample users, what tools to use to conduct surveys, and how to analyze the results.
In my last year at LinkedIn, I became a true advocate for the use of the NPS customer loyalty index as a key performance indicator (KPI). NPS is a great addition to our standard set of acquisition, retention and monetization indices and has become a metric to help improve product quality and value for consumers.
The Net Promoter Score (NPS) consumer loyalty index was created in 2003 by Fred Reicheld of Bain & Company. I recommend anyone interested in this subject to read his article The One Number You Need to Grow, published in the Harvard Business Review.
Fred claimed that the NPS index performed just as well as long user satisfaction surveys. Firstly, NPS involves only one question, and secondly, it correlates well with the long-term growth of the company.
How NPS is calculatedYou need to ask customers a simple question: "Do you enjoy recommending our company to friends or colleagues?". The answer is a number from 0 to 10. As a result, respondents are divided into supporters of your product (9-10 points), neutral consumers (7-8 points) and critics (0-6 points).
To get the NPS index, you need to subtract the percentage of detractors from the percentage of supporters. The number can range from -100 (if all polled users are critics) to +100 (all supporters). An NPS greater than zero is considered good, and a score of +50 indicates excellent loyalty.
Additional questionsIn addition to the main question, you can ask clients open-ended questions like: “Why did you give the company such a rating?”. This method makes NPS not only a metric for your success today, but also a basis for improving future performance.
It can also be helpful to ask customers how willing they are to recommend similar or alternative competitor products. This will allow you to correlate your NPS with indexes from other manufacturers. Just keep in mind that these results will not be objective enough: instead of polling a random sample of potential consumers (including those who choose competitors), you are considering already established own users.
You should think carefully before asking clients additional questions about the reasons for their ratings: of course, this will help you understand the situation better, but at the same time, it will significantly reduce the speed of responses. Either way, you'll have to compromise.
Grade Collection MethodsFor online evaluation products, NTS typically either conduct email surveys or introduce reminder prompts into the product acquisition process. To increase your response rate, it's important to cover both desktop and mobile versions of your product. You can create a survey tool yourself, but I usually recommend using one of the pre-built solutions that support collecting and analyzing responses from all channels and interfaces, such as SurveyMonkey .
One of the problems with these surveys is the obvious bias towards more engaged customers, as those who are dissatisfied with the product are likely not to respond to emails either. Below we will talk about how to deal with this.
Sampling for NPSIt is very important that each NPS survey be conducted on a random representative sample of consumers. We often encountered the fact that the respondents were not really random. For example, there is a strong correlation between NPS results and engagement, or the length of time a customer uses a product. Try to ensure that the sample reflects exactly the degree of involvement and period of use of the product that is typical for the entire user base.
Poll frequencyFirst, the size of your user base matters a lot. The smaller it is, the larger the sample you will have to interview and the longer you will have to wait until you get enough answers. This imposes restrictions on when the next poll starts.
Second, the frequency of surveys can be related to the product development cycle. It is product improvements that drive NPS growth, so the frequency of surveys should depend on how quickly you are running each iteration.
NTS is a lagging indicator. Once you've implemented changes to the user experience, it takes some time for customers to feel them and then reflect them in their ratings.
We at LinkedIn have found that the best frequency to conduct surveys is quarterly, which is in line with our quarterly product planning cycle. This allowed us to get the most up-to-date estimates before starting the next quarterly planning. We were able to quickly respond to the results of our surveys when compiling the next roadmap.
Analytical teamIf you are using NPS to improve user experience, it makes sense to share survey data with everyone involved in product development.
At LinkedIn, we included not only product managers in the core NPS team, but also those involved in product marketing, market research, and business operations. Every quarter, we shared our discoveries with the entire R&D team. Of course, a lot depends on how you organize product development, but it is still important that the right stakeholders are involved in this process from the very beginning.
Comment analysisExploring user comments and responses to open questions is the most useful part of NPS analysis. Once a quarter, after each survey, we read the responses of clients and divided into thematic categories all the pros and cons that they met.
Based on this categorization, we made suggestions on how to improve user experience and eliminate pain points. Having to read every comment can seem intimidating, but there is no substitute for this procedure: so you can listen to the voice of each client and find out how they articulate their experience with the product.
Behavior of supportersWe spend quite a bit of time investigating negative feedback and addressing the issues associated with it, but we've found it just as helpful to understand the characteristics of a positive user experience.
Comparing NPS results with customer behavior strategy (when registering, searching, viewing profile), we saw a significant correlation between certain product actions and higher NPS. So we highlighted the moments when customers really liked using the product. And then we focused on product optimization to bring as many users from our base as possible to this point.
The easiest way to achieve this is to research each major action with your product and see if there are clear correlations with NPS scores.
MethodologyWe found that NPS is sensitive to methodological changes. Therefore, it is important to be very consistent in survey methodology. The order of the questions and the list of competitors you ask about matters. The sampling approach itself also matters. Change methodology as little as possible.
seasonalityThe NPS results are influenced by the seasonal factor. We've seen this for ourselves and heard it's true for other businesses as well. To minimize the effect of seasonality, it makes sense to compare annual rather than quarterly changes. At the very least, you should be aware of how it can affect your grades.
NPS limitsNPS is an effective metric for understanding user loyalty and developing an action plan to increase it, but this method has limitations that you should be aware of.
1. The relatively low frequency of NPS results makes it a weak operational metric for tracking your daily activities. So keep using your current acquisition, retention, and monetization tools to track regular performance, A/B testing, and other optimizations.
2. The margin of error of the NPS results depends on the size of your sample. It is important to be aware of this and not worry about small discrepancies in the results of two consecutive tests. Classical tools like engagement metrics don't have big sample requirements and their margin of error is much smaller.
3. NPS analysis is by no means a substitute for your product strategy. This tool only gives an understanding of how customers perceive the product and what exactly to optimize in order to better implement an existing strategy.
I saw NPS questionnaires on the websites of large banks, online stores, received SMS with surveys from mobile operators. The first reaction is to go to a marketer and set the task of implementing a consumer loyalty index counter on your site. I'm sure that's what a lot of people do.
The purpose of this article is to warn about a dangerous mistake in marketing: the thoughtless and incorrect implementation of the NPS questionnaire.
Why do you need a Net Promoter Score?An employee of the consulting agency Fred Reicheld analyzed customer loyalty to a variety of companies in the United States: passenger air transportation, insurance, car rental. Hundreds of corporations, schemes of work and thousands of different questionnaires. As a result, there is zero opportunity to compare customer loyalty of several companies in the same field.
As an alternative, Fred suggested making a questionnaire with a single question: "How likely is it that you would recommend our company/product/service to a friend or colleague?", and a ten-point scale.
The advantage of just such a questionnaire over a standard set of answers is its versatility. A client can express what he thinks about your company / product with a single assessment.
Another question is to interpret what this assessment means. After filling out the questionnaire, the feedback procedure with the respondent comes into action to answer the question: why you can (or cannot) recommend our service. In some cases, a third question is asked about what the company can do to improve.
There is no single algorithm here. Sometimes the corresponding form is asked to fill out immediately after the first step, sometimes they catch up with a letter or a call.
If the players adopted this metric, Fred believed, it would be easier for every company in a competitive industry to fix customer problems, increase profits, and instantly measure the effectiveness of innovations.
According to Reicheld, in most industries there is a correlation between the level of growth of a company and the number of promoters among its clients (those who chose 9-10):

I don’t know if the work in one of the reputable US consulting agencies (Bain & Company) helped the researcher, but almost everyone agreed with Reicheld’s proposal. Including Fortune 500 companies.
The hypothesis of the consumer loyalty index is criticized for the selectivity of areas in which a correlation was observed between the indicators of the questionnaires and the dynamics of the development of companies. If your topic is not featured in popular studies like the Temkin Group's Net Promoter Score Benchmark Study, it's worth considering.
Consumer Loyalty Index - NPS FormulaEverything would be too simple if it were limited to uploading the averages of the questionnaire for the monthly report.
Firstly, the entire pool of respondents is divided into three parts, depending on the ratings:
- 1-6 - detractors. In other words, brand critics. Among them, most of all are zealous authors of negative reviews and future customers of your competitors;
- 7-8 - neutrals. Such clients are less likely to generate negative, but there is no guarantee that they will remain your clients in the future. Any breath of wind - and they will leave;
- 9-10 - promoters. Brand fans, longtime customers who actively promote the company's products and generate positive reviews. Usually they are most willing to communicate with managers.

For lovers of mathematics - a more complex calculation with the calculation of the variance of the study.
The NPS index is sometimes written without a percent sign - 60 instead of 60%.
When you install the questionnaire and take the first measurement, you will get a result from -100 to 100.
Q: When should measurements be taken? There is no consensus - there are too many differences between companies and customer needs in different areas.
Promoter.io CEO Chad Keck advises asking another question: how often do you show a questionnaire to a client?
If this is a mobile application user, the frequency can be as follows:
- 7-15 days after installation;
- 30-90 days after the first survey;
- 90 days after the second survey.
The 90-day cycle was chosen because, according to most Promoter.io customers, the company has a 90-day window before the detractor removes the application.
In other areas, this window may not exist at all - the questionnaire is sent after some key action is performed. In online stores, for example, it is recommended to send the NPS questionnaire to the customer after receiving the goods, since then both the work of the staff and logistics are evaluated.
To learn more about the ins and outs of online projects and ROI, I recommend subscribing to the blog newsletter:
Send
Difficulties in translationReicheld's idea was to ask one question, in one single wording. Because of the translation, the question seems to remain the same, but the amount of wording changes it beyond recognition:
- On a scale from zero (“Never recommend”) to ten (“Definitely recommend”), how likely are you to recommend this product to a friend or colleague? Ain.
- Are you ready to recommend our products or services to your friend or colleague? Texterra.
- What is the probability that you will recommend the company/product/brand to your friends/acquaintances/colleagues? Wikipedia.
- On a scale of 0 to 10, rate the likelihood that you would recommend the company to a friend or colleague. SMS from "Hello".
Agree, in this case, you still need to choose the wording that the client will read to the end and understand correctly. For example, to the question: "Are you ready to recommend our products or services to your friend or colleague?" - I would never answer 10. Because it only implies yes / no.
Net Promoter System: more than an indexIn an updated edition of the book on the main question for business development, Fred Reicheld stands for NPS as Net Promoter System (proof).
Indeed, the consumer loyalty index is not a number in the report. Behind this figure lies a set of analytics techniques and detailed procedures for interacting with the user. In fact, this is already a full-fledged loyalty building system by increasing the percentage of company promoters.
Bain & Company claims that NPS is an integral business philosophy based on four points:

The implementation of the Net Promoter System involves five important steps and at least two teams of employees who manage the internal and external loyalty cycle.
What are these steps?
1. Provide ongoing support from management. The management of the company, the CEO in particular, should determine as the most important business priority to increase the number of promoters and reduce the number of brand critics. They must embed customer-centricity into the company's development strategy and be the first to become role models to train employees.
2. Start interpreting research in a consistent way. Over time, it turns out that not only a single method of interviewing customers / employees is needed, but also a single method of interpreting the results. First of all, for the correct individual classification of customers and employees of the company. This is the only way to determine the value of investments in improving the quality of customers and the professionalism of employees.
3. Set up feedback, learning and improvement processes. The Net Promoter System is based on learning mechanisms for individual employees and the company as a whole. The internal loop gives key employees and teams real-time feedback from customers, allowing them to quickly respond to changes in loyalty levels. Regular feedback helps employees make decisions on their own: in which direction to develop.
Closed meetings become short working group meetings, the purpose of which is to motivate each participant to work better with clients and create more promoters. It is also here that changes concerning the company as a whole are born and discussed.
The task of the outer loop is to support customer-centric changes in the company. The team uses feedback from closed meetings, live data, and market insights to provide in-depth insights into customer issues and prioritize a set of initiatives to improve customer experience.
4. Create an atmosphere of loyalty among employees and teams. The company's specialists must clearly understand how their work affects clients, and be inspired by this in order to inject 100% of enthusiasm, creativity, and energy into the tasks performed. This requires setting up ERP / CRM tools and creating an atmosphere of constant learning. You will also need to set up a motivation system with the help of bonuses and gamification.
5. Create a strong operational and analytical infrastructure. Another foundation of the Net Promoter System is very fast feedback. Need trained people to solicit feedback, collect responses, track customer follow-ups, analyze data. The guys who do this should be regularly motivated by the outer loop team and have excellent analytical skills.
That is, if you are implementing NPS and want a result, the matter will not be limited to a questionnaire.
In my opinion, only high-tech companies, such as SaaS projects, can afford the full implementation of the Net Promoter System, which can correctly analyze and evaluate every step of the client.
Since Netpeak specializes in promoting, in particular, SaaS projects, I will tell you how we implemented the NPS questionnaire in the Serpstat multifunctional SEO platform.
How Serpstat Implemented an NPS Questionnaire Using SatisMeterAmong the advantages of SatisMeter are quick integration to the site, automatic translation into most languages of the world, customization of the questionnaire and the provision of real-time analytics.

The service can be tested for free on 100 responses. It is the answers, not the displays of the questionnaire.
You can also integrate the service with Intercom, Slack, Segment, send surveys as in-app messages and emails.

For the questionnaire, you can ask:
- color scheme;
- location on the screen;
- delay in seconds before showing;
- subject, text and signature, if this is a letter;
- frequency of sending reports;
- Company name;
- the language of the questionnaire (you can set up multilingualism, but you need to contact support);
- whether a text response is required for the assessment.
Another important bonus is that you can add users with administrator rights.
You can install SatisMeter using:
- segment.com;
- Eager.io
- iOS SDK;
- HTML snippet.
Serpstat configured the service using HTML Snippet. To do this, a custom HTML tag with the following code was added to Google Tag Manager:
(function() ( window.satismeter = window.satismeter || function() ((window.satismeter.q = window.satismeter.q || ).push(arguments););window.satismeter.l = 1 * new Date();var script = document.createElement("script");var parent = document.getElementsByTagName("script").parentNode;script.async = 1;script.src = "https://app.satismeter.com /satismeter.js";parent.appendChild(script);))(); satismeter(( writeKey: "my_satismeter_key", userId: "1234", // TODO: Current user unique ID (required) traits: ( name: "John Doe", // TODO: Current user name (optional) email: " [email protected]", // TODO: Current user email (optional) createdAt: "2016-11-16T17:01:19.518Z" // TODO: Date when user was registered (optional) ) ));
The required parameter is only the user ID. If you already have a User ID configured ( how to do it), just use that ID.
As a result, the code will become like this:
(function() ( window.satismeter = window.satismeter || function() ((window.satismeter.q = window.satismeter.q || ).push(arguments););window.satismeter.l = 1 * new Date();var script = document.createElement("script");var parent = document.getElementsByTagName("script").parentNode;script.async = 1;script.src = "https://app.satismeter.com /satismeter.js";parent.appendChild(script);))(); satismeter(( writeKey: "my_satismeter_key", userId: ((DLV - User ID))) ));
Actually ((DLV - UserID)) is a data layer variable for getting the User ID.
Since the service does not determine which users to show the questionnaire to, the parameters must be set independently. You can, for example, define a list of IDs to which you want to send a survey, and pass a special event to the dataLayer, by which to activate the survey tag.
Serpstat chose the following segment:
Language is en first payment count is 1 plan is not Registered user email does not contain [list of individual users and user groups] country is not Russian Federation country is not Ukraine country is not Belarus country is not Kazakhstan
In order not to involve developers at all to transfer new data to the datalayer, the specialists obtained the IDs of such users from Intercom and configured the activation of the questionnaire tag:
if((function() ( var arr = [ // list of IDs from Intercom ]; if (arr.indexOf(((DLV - userId))) >= 0) return(arr.indexOf(((DLV - userId)) ) + 1); else return undefined; )) ()) ( dataLayer.push(( "event":"gtmUaEvent", "eventCategory":"SatisMeter", "eventAction":((DLV - userId)), "eventLabel ":document.location.href, "eventNonInteraction":true )); )
The tag is activated under the following conditions:
"event":"gtmUaEvent", "eventCategory":"SatisMeter"


An easier and more economical option is to set up a survey using free services like userreport or GetResponse survey forms. Agency specialists often do this at the request of clients.
How to set up NPS using the free service userreport.comUserreport specializes in conducting online surveys. The service integrates with Google Analytics, supports the collection of email addresses, customization of forms. Plus, a good translation into Russian. It's amazing that it's free at all.

The only negative is that the service does not have settings for activating the display of messages. But the invitation can be activated using Google Tag Manager. The scenario can be as follows: the user must spend at least 3 minutes on the site.
The algorithm of actions will be as follows:
1. Create a "Timer" trigger. Take 30,000 as the interval, 7 limits.
2. Create custom HTML tag with UserReport code and activation rule:
(event = show-user-report) + (page that is not a shopping cart) + (page that is not a step in the checkout process).
3. Create a custom HTML tag with an activation rule based on the timer configured above. The tag should contain a script that checks the difference between the current and saved time. If the difference is greater than 3 minutes, an event with the value show-user-report should be written to the dataLayer.
try ( var n = (new Date()).getTime(); if (localStorage.getItem("time") == null) ( localStorage.setItem("time",n); ) var time = parseInt(localStorage. getItem("time")); var dif = n - time; if (dif >= 180000000) ( localStorage.setItem("time",n); ) if (dif >= 180000) ( dataLayer.push(("event ": "show-user-report")); ) ) catch (e) ( )
The results of the NPS questionnaire from the service can be sent to Google Analytics using custom dimensions. To do this, you need to set up integration with Google Analytics:

1. Not everyone understands why this is necessary. If business owners are not ready to change their minds and implement the Net Promoter System, other questionnaires may indeed make more sense.
2. Not everyone understands how to do it. In Runet, there is still little information about the loyalty index, especially cases. I hope this post and your comments fill that gap.
Banks were among the first to introduce consumer loyalty index. In 2016, a survey of banks was even conducted in Russia, according to which the average NPS level is 30. In the USA, the average NPS among banks is 32 points.
Quite comparable figures, although there is usually a greater variation in estimates in countries with different cultures.

Moreover, the NPS of multinational corporations may differ in different states. For example, the Apple Loyalty Index in 2015 was 57 in France and 71 in the US.
By the way, in the same Temkin Group, they noticed a pattern in all 20 areas of the study: the lowest rates were obtained from young users (under 35 years old). The sample of users from 35 to 44 left the highest ratings for companies in almost all areas.
conclusions1. The introduction of the consumer loyalty index should be considered only as the initial stage of introducing the Net Promoter System into the structure of the company. Otherwise, there is no more sense from the numbers of the NPS questionnaire than from the results of voting under a dictatorship.
2. Before implementing NPS, examine whether there has been a correlation between the results of the index and the dynamics of the company in your field. The consumer loyalty index in the West has been considered for almost 15 years, there is enough data on the topic in the public domain.
3. Choose the translation of the phrase “How likely is it that you would recommend our company/product/service to a friend or colleague?” that suits you.
4. When installing the NPS questionnaire, be sure to specify the correct display time and customer survey period. There are no universal recipes, it all depends on the field. Online stores, for example, should ask to fill out a questionnaire not at the time of payment for the purchase, but after the delivery of the goods. For mobile applications, there is a window of 7-15 days after installation before the first display of the questionnaire, and so on.
5. Install the questionnaire using SatisMeter and Google Tag Manager - you will get more opportunities for data analysis and a scalable basis for further work within the Net Promoter System.


Popular
- Creating a brand from scratch: the experience of marketers
- SMM (SMM) Social media marketing
- Spin method in sales, examples
- Notable Entrepreneurs
- How to open a children's development center from scratch
- How to open a gas station: a business of serious investments and profits
- How to open a children's development center
- Some tips on what to sell to earn
- Equipment for the shop of semi-finished meat products
- Freight forwarding company: how to open a business from scratch